Sunspot drawings at Kodaikanal Solar Observatory Library
The importance of periodicity in sunspot appearance was well recognized by the mid-19th century. It marked a significant milestone in our understanding of solar activity and its broader implications for the Earth’s climate and space weather. By observing and documenting the cyclical nature of sunspots, astronomers began to unlock the patterns of solar behaviour, laying the groundwork for modern solar physics. The process of creating these sun charts was intricate. Astronomers would observe the Sun through telescopes equipped with special filters to protect their eyes and reveal specific features of the solar surface. They would then sketch what they saw, noting the positions and sizes of sunspots, the brightness of faculae, and the intricate shapes of prominences and filaments. These sketches were often enhanced with annotations and color-coding to differentiate between various features, creating a vivid and informative picture of solar activity.

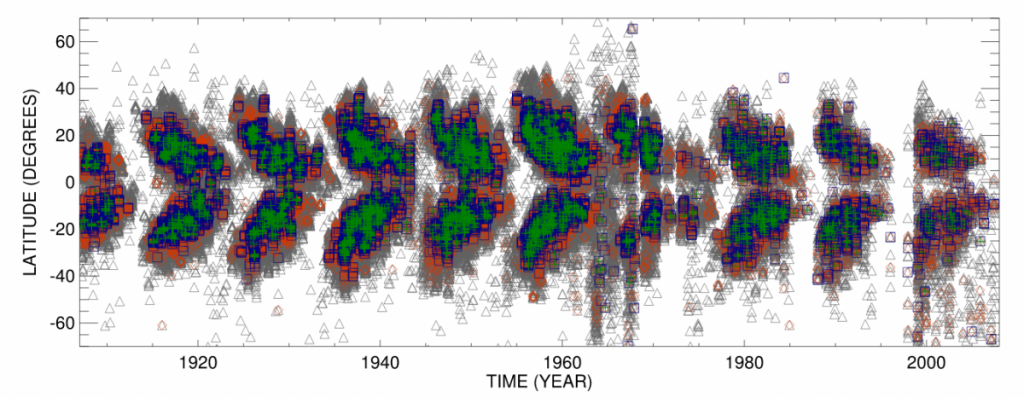
The Kodaikanal Solar Observatory (KSO) has been capturing solar images since 1904, utilizing broadband white light, narrow band Ca-K 393.37 nm, and Hα 656.3 nm wavelengths. The KSO Library houses solar sun charts dating back to April 1904. To register each sunspot’s relative position and age, an astronomer projects the day’s images onto a Stonyhurst grid. This grid represents latitudes and longitudes, allowing astronomers to track the movement of sunspots as the Sun rotates about its axis every 27-28 days. This method enables the calculation of the slight differences in rotation periods between the Sun’s northern and southern hemispheres. The grid size is 5◦ in both the latitude and the longitude direction. These drawings are made with sharp-edged HB pencils. The central longitude number of the day is marked for reference, and the images are color-coded: borders of the plages in blue ball pen, The edges of solar filaments in red pencil, and limb prominences in blue pencil. To ensure consistency, the same observer performs this task daily, creating bound booklets called sun charts, each containing six months observations.

In the modern era, while digital imaging and advanced telescopes have revolutionized solar observation, the value of these historical sun charts remains undiminished. They provide a critical baseline for understanding how the Sun’s activity has changed over time. Moreover, they are a testament to the meticulous work of past astronomers who, with limited technology, managed to create accurate and detailed records of the Sun’s behavior. The KSO continues this tradition today, using both traditional and modern techniques to monitor the Sun. This dual approach allows for a seamless integration of historical data with contemporary observations, offering a comprehensive view of solar activity across more than a century. The legacy preserved in these sun charts is not just a record of the past but a tool for future discoveries. By studying these records, scientists can better predict solar cycles and understand the potential impacts of solar activity on our planet. The sun charts housed in the KSO Library are a precious scientific heritage, capturing the Sun’s dynamic nature over more than a century. They bridge the past and present, offering insights that are crucial for advancing our understanding of the Sun and its influence on the Earth. The ongoing efforts to preserve and expand this legacy ensure that we can continue to unravel the Sun’s secrets for generations to come.